Does Lowering AHT Increase Contact Volume?
- Graeme Colville
- Jun 15
- 6 min read
Updated: Jul 6
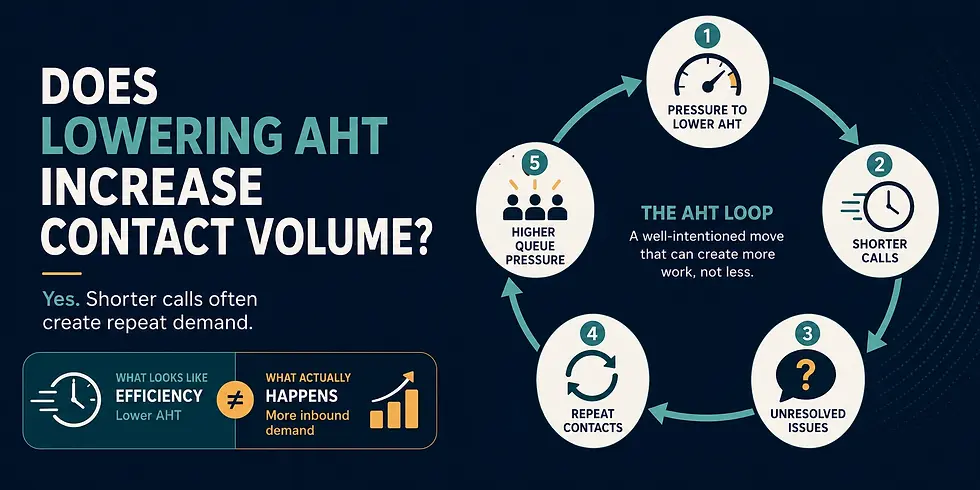
The Quick Answer: Does lowering AHT increase contact volume? Yes, and it comes down to a structural failure called the AHT Loop. When agents are pressured to lower handle time, calls close early, creating a structural loop of repeat contacts. This drives partial resolutions and generates repeat contacts, ultimately increasing total inbound volume and queue pressure.
Every week, in contact centres around the world, the same meeting happens.
Someone opens a PowerPoint or pulls up a RAG dashboard. They compare this week to last—answer rates, wait times, abandon rates. The numbers aren’t good enough. A decision gets made quickly: we need to drop the average handle time.
The first time it happens, someone in the room might push back. Ask a question. Challenge the logic. By the third or fourth time, they’ve stopped. Not because the logic got better, but because they learned that pushing back doesn’t change the outcome—it just makes you look like the problem. So they nod. They take the message back to their team. And the loop begins.
What follows isn’t a performance improvement. It’s a damage sequence—to your customers, your frontline staff, and eventually your cost base. And it plays out the same way in every operation that treats handle time as a capacity lever.
What Is AHT?
The Average Handle Time Definition
Average Handle Time (AHT) is the total time an agent spends on a single customer contact from connection through to the completion of after-call work. It has three components:
Talk time:
The duration of the live conversation
Hold time:
The time the customer spends on hold during the contact.
After-call work (ACW):
Administrative tasks completed after the call ends, such as logging, updating records, or completing case notes.
The formula is straightforward: (Talk Time + Hold Time + After-Call Work) ÷ Number of Contacts Handled.
AHT is a time-based measurement. It tells you how long a contact took. It does not tell you what the contact achieved.
At a workforce management level, AHT is genuinely useful—it informs staffing models, scheduling, and capacity planning. The problems begin when it moves from an input into a workforce model into a measure of agent or operational performance. At that point, something designed to describe workload starts being used to judge resolution quality—a job it was never built to do.
What Does AHT Actually Measure? (And What It Misses)
AHT measures speed. Specifically: how quickly contacts complete.
What AHT does not measure:
Whether the customer's issue was resolved.
Whether the customer will call back about the same issue.
Whether the agent ended the call before the underlying problem was fixed.
Whether the contact was avoidable—generated by a failure that happened upstream in the service journey.
A 3-minute call that leaves an issue unresolved scores better on AHT than a 7-minute call that fully resolves it. The metric cannot distinguish between them. That is not a flaw in how you are applying AHT—it is a fundamental limitation of what the metric is capable of capturing.
How the AHT Target Travels: The 4 Layers of Pressure
The pressure doesn’t start at the front line. It starts in a leadership meeting and travels downward—changing shape at each layer, losing context at every step.
Senior leadership
reacts to a dashboard. Call volumes are up. Wait times are rising. The instinct is to look for capacity. Handle time looks like the lever. A target gets set.
Middle management
receives the target. They may have reservations, but challenging it carries risk. They take ownership of the message.
Team leaders
are now responsible for delivering the target to their teams. Some privately sympathize with agents, but the target doesn’t move.
Frontline agents
receive the pressure directly. They’re told to handle calls faster. They’re shown metrics. They watch others around them hit the target, and they feel the gap.
By the time the pressure reaches the front line, all the context has been stripped away. What remains is a number. And the message that the number must come down.
The 4–6 Week Window: Pushing Good Agents Into Bad Decisions
Not everyone responds to the pressure immediately. Some agents resist. They keep handling calls with the diagnostic depth the customer actually needs. These are often your strongest performers.
But across hundreds of operations, a pattern repeats itself. Within four to six weeks of sustained pressure, even the holdouts change. It usually happens after weeks of hearing colleagues hit the target, and one conversation that makes them feel like they’re the problem.
And then they do something dramatic to get the number down:
Rushing callers: Getting to a resolution… any resolution… fast.
Redirecting demand: Telling customers to email instead. The demand doesn’t disappear; it moves somewhere harder to measure.
Deflecting entirely: Telling callers to ring back later. The metric resets. The customer’s problem doesn’t.
Cutting calls: Connecting briefly for two or three seconds, and disconnecting.
Here’s what makes this phase particularly damaging: leaders reward it. The numbers start looking better. A team leader praises the improvement. For a few weeks, the agent who found the most aggressive way to cut call time is held up as a success.
When Praise Becomes a Disciplinary: The Hidden Cost of AHT
The discovery of what’s happening rarely comes from someone looking for misconduct. It comes sideways—a spike in complaints, a QA review, or someone noticing a pattern of three-second calls.
The leader who praised the improving numbers now has to address the behavior that produced them. What almost never happens in that disciplinary conversation is any acknowledgment that the system designed the outcome it’s now punishing someone for. The individual is let go.
And then the operation absorbs costs it never attributed to the target:
Recruitment costs for the replacement hire.
Onboarding and training time.
Lost institutional knowledge and operational context.
The target didn’t just fail to solve the capacity problem. It manufactured a disciplinary case and a recruitment cost.
What Causes High AHT in a Contact Centre?
High AHT is typically caused by four structural conditions—not agent pace or communication style.
Incomplete resolution authority: Agents cannot resolve the contact without escalating or seeking approval. Every handoff adds time.
Process complexity beyond the documented version: Workarounds and system limitations add time that management cannot see in training materials.
Partial resolutions: Contacts close without the underlying issue being fully fixed. The next contact is longer because the history is now more complex.
Demand type mismatch: Complex contacts are routed to agents without the capability to resolve them.
Coaching handle time in the presence of any of these four conditions produces no sustainable improvement.
The Structural Loop: What Happens When You Optimise for AHT

When handle time becomes a target, agents shorten calls. The call closes. The issue does not. The customer calls back.
That repeat contact adds to total volume. Higher volume increases queue pressure. Queue pressure intensifies focus on AHT. The metric designed to manage efficiency starts generating the demand it was supposed to control. This is the AHT Loop.
In one operation we audited, a 3-minute reduction in AHT resulted in an increase of 1,500 inbound contacts per month—71% of which were repeat contacts from early closures. After structural intervention, First Contact Resolution moved from 9% to 21%, and total volume fell.
The metric improves while the underlying problem compounds. What we reduce by one minute in one call generates another four-to-five-minute call where the customer was not given what they needed the first time. This is not a trade-off. It’s a debt.
How to Break the Loop: A Contained Starting Point
The conventional approach to improving AHT—coaching agents to handle calls faster—reliably reduces handle time while increasing repeat contact volume. If the goal is to stabilize your operation without generating more inbound demand, the starting point is not duration. It is resolution.
Stability in a contact centre does not come from calls getting shorter. It comes from fewer calls returning.
If this pattern is showing up across your operation, you do not need more dashboards. You need a structural intervention.
To map the exact failure demand your targets are generating, deploy the AHT Loop Workbooks. This is a guided implementation system designed to help leaders locate their structural constraints, redesign resolution authority, and build the evidence required to stop coaching handle time and start fixing the system.
Not sure if the AHT Loop is your primary constraint? Use the Performance Scorecard to diagnose your operation's structural failure in under eight minutes.
If you want a structured, guided path through this — from demand categorisation to a controlled pilot, the AHT Loop Intervention walks you through it end to end.
FAQ
Does lowering AHT increase contact volume?
Yes. When diagnostic depth drops due to shortened interactions, unresolved demand returns as repeat contacts—increasing total volume rather than reducing it.
Why do repeat calls increase after AHT improves?
Because shorter interactions trade resolution for throughput. The call ends, but the customer’s need doesn’t. They call back, often requiring more handling time the second time around.
What should contact centres measure instead of AHT?
Recontact rate within 7–14 days, recurring demand patterns, first contact resolution failure modes, and demand created by process gaps. Duration tells you how long calls take; these measures tell you whether demand is actually being resolved.
What causes high AHT in a contact centre?
High AHT is most commonly caused by incomplete agent resolution authority, undocumented process complexity, partial resolutions that generate repeat contacts, and routing complex contacts to agents without the capability to resolve them.
What is the AHT Loop?
The AHT Loop is a structural failure pattern in which managing handle time as a performance target causes agents to shorten calls without resolving issues, generating repeat contacts, increasing total volume, and intensifying queue pressure—which in turn increases focus on AHT.


Comments